Non-linear Static Analysis (Elastoplastic, Part 2)
Non-linear Static Analysis (Elastoplastic, Part 2)
This analysis uses the data of tutorial/06_plastic_can.
Analysis target
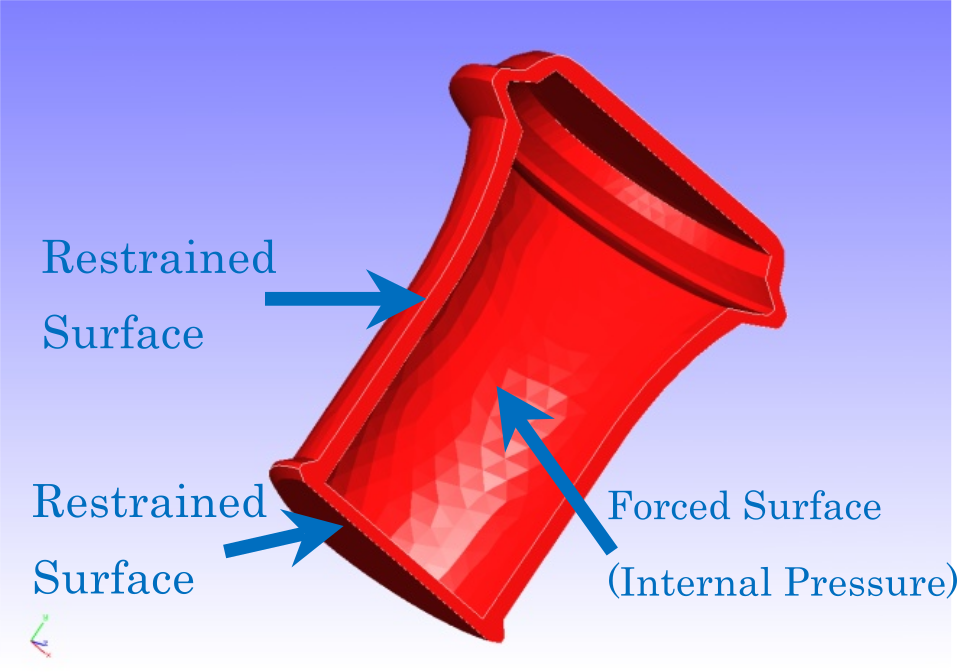
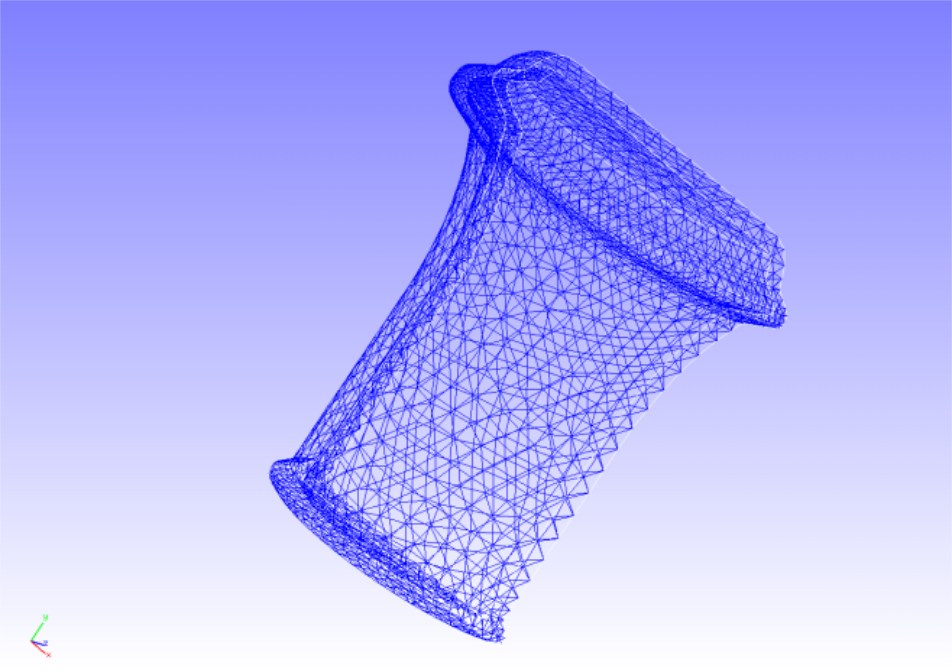
The target of this analysis is a 1/2 model of a container whose shape and mesh data are shown in Figs. 4.6.1 and 4.6.2, respectively. The mesh is a tetrahedral secondary element with 7236 elements and 14119 nodes.
| Item | Description | Notes | Reference |
|---|---|---|---|
| Type of analysis | Non-linear static analysis(plastic) | !SOLUTION,TYPE=NLSTATIC | |
| Number of nodes | 14,119 | ||
| Number of elements | 7,236 | ||
| Element type | Ten node tetrahedral quadratic element | !ELEMENT,TYPE=342 | |
| Material name | M1 | !MATERIAL,NAME=M1 | |
| Material property | ELASTIC, PLASTIC | !ELASTIC !PLASTIC,YIELD=DRACKER-PRAGER | |
| Boundary conditions | Restraint, Distribution force | !DLOAD | |
| Matrix solution | CG/SSOR | !SOLVER,METHOD=CG,PRECOND=1 |
Analysis content
A stress analysis is performed by restraining the displacement of the restraining surface as shown in Fig. 4.6.1 and applying distributed loads to the inside of the vessel as a forced surface. The Drucker-Prager model is used for the yield function. The analytical control data are shown below.
Analysis control data can.cnt
#  Control File for FISTR
## Analysis Control
!VERSION
 3
!SOLUTION, TYPE=NLSTATIC
!WRITE,RESULT
!WRITE,VISUAL
## Solver Control
### Boundary Conditon
!BOUNDARY, GRPID=1
 BND0, 3, 3, 0.000000
!BOUNDARY, GRPID=1
 BND1, 1, 1, 0.000000
 BND1, 2, 2, 0.000000
 BND1, 3, 3, 0.000000
!DLOAD, GRPID=1
 DL0, S, 1.0
!DLOAD, GRPID=1
 DL1, S, 1.0
!DLOAD, GRPID=1
 DL2, S, 0.5
### STEP
!STEP, SUBSTEPS=10, CONVERG=1.0e-5
 BOUNDARY, 1
 LOAD, 1
### Material
!MATERIAL, NAME=M1
!ELASTIC
 24000.0, 0.2
!PLASTIC, YIELD=DRUCKER-PRAGER
 500.0, 20.0, 0.0
### Solver Setting
!SOLVER,METHOD=CG,PRECOND=1,ITERLOG=NO,TIMELOG=YES
 20000, 1
 1.0e-8, 1.0, 0.0
## Post Control
!VISUAL,metod=PSR
!surface_num=1
!surface 1
!output_type=VTK
!END
Analysis procedure
Execute the FrontISTR execution command fistr1.
$ cd FrontISTR/tutorial/06_plastic_can
$ fistr1 -t 4
(Runs in 4 threads.)
Analysis results
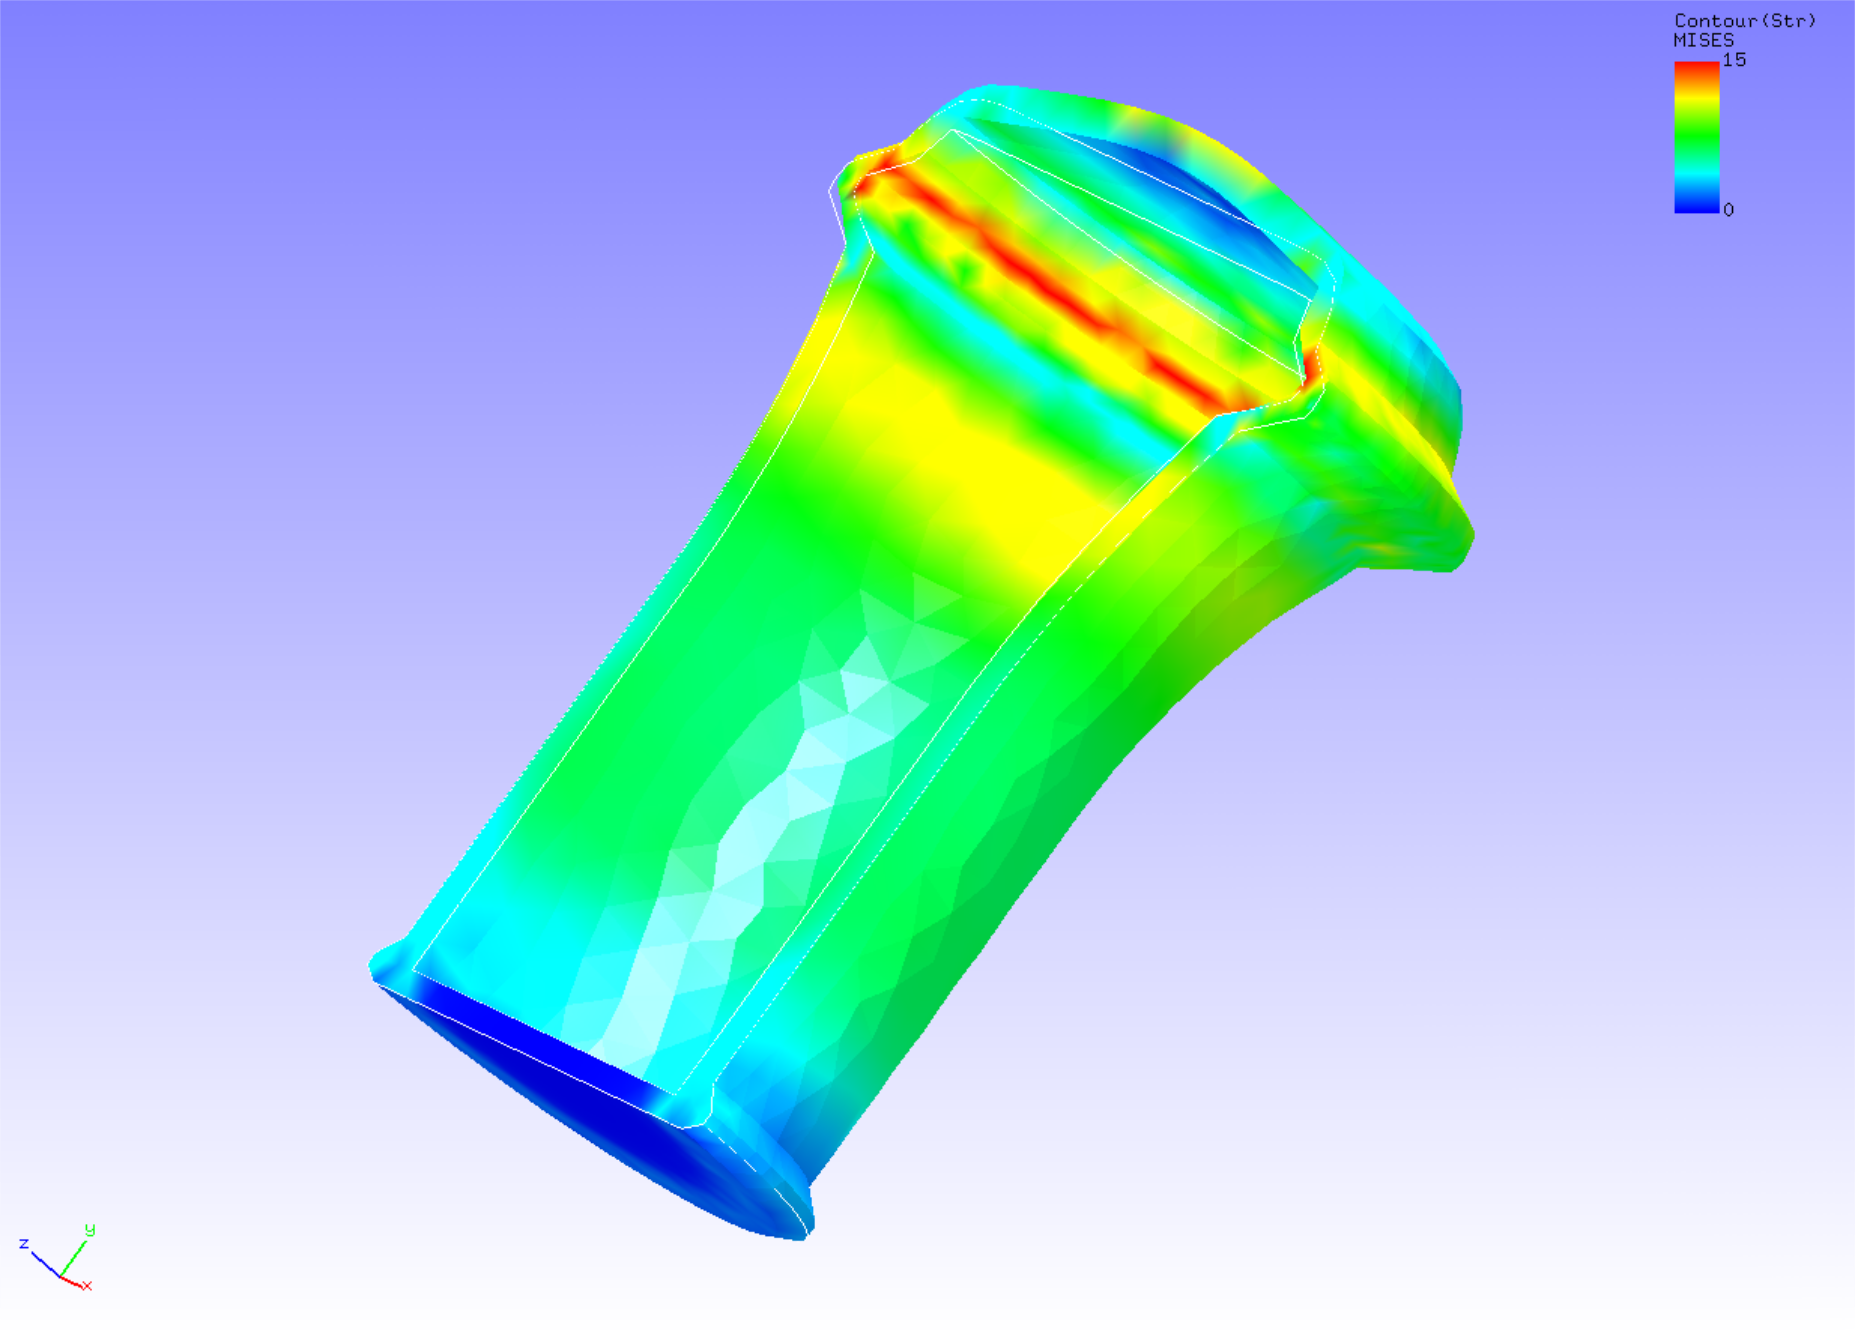
For the results of the tenth substep analysis, a deformation diagram with the Mises stress contours added is created by REVOCAP_PrePost and shown in Figure 4.6.3. The deformation factor is set to 30. A part of the log file is shown below as numerical data of the analysis results.
Log file 0.log.
 fstr_setup: OK
#### Result step=     0
 ##### Local Summary @Node    :Max/IdMax/Min/IdMin####
 //U1    0.0000E+00         1  0.0000E+00         1
 //U2    0.0000E+00         1  0.0000E+00         1
 //U3    0.0000E+00         1  0.0000E+00         1
 //E11   0.0000E+00         1  0.0000E+00         1
 //E22   0.0000E+00         1  0.0000E+00         1
 //E33   0.0000E+00         1  0.0000E+00         1
 //E12   0.0000E+00         1  0.0000E+00         1
 //E23   0.0000E+00         1  0.0000E+00         1
 //E31   0.0000E+00         1  0.0000E+00         1
 //S11   0.0000E+00         1  0.0000E+00         1
 //S22   0.0000E+00         1  0.0000E+00         1
 //S33   0.0000E+00         1  0.0000E+00         1
 //S12   0.0000E+00         1  0.0000E+00         1
 //S23   0.0000E+00         1  0.0000E+00         1
 //S31   0.0000E+00         1  0.0000E+00         1
 //SMS   0.0000E+00         1  0.0000E+00         1
 ##### Local Summary @Element :Max/IdMax/Min/IdMin####
 //E11   0.0000E+00         1  0.0000E+00         1
 //E22   0.0000E+00         1  0.0000E+00         1
 //E33   0.0000E+00         1  0.0000E+00         1
 //E12   0.0000E+00         1  0.0000E+00         1
 //E23   0.0000E+00         1  0.0000E+00         1
 //E31   0.0000E+00         1  0.0000E+00         1
 //S11   0.0000E+00         1  0.0000E+00         1
 //S22   0.0000E+00         1  0.0000E+00         1
 //S33   0.0000E+00         1  0.0000E+00         1
 //S12   0.0000E+00         1  0.0000E+00         1
 //S23   0.0000E+00         1  0.0000E+00         1
 //S31   0.0000E+00         1  0.0000E+00         1
 //SMS   0.0000E+00         1  0.0000E+00         1
 ##### Global Summary @Node    :Max/IdMax/Min/IdMin####
 //U1    0.0000E+00         1  0.0000E+00         1
 //U2    0.0000E+00         1  0.0000E+00         1
 //U3    0.0000E+00         1  0.0000E+00         1
 //E11   0.0000E+00         1  0.0000E+00         1
 //E22   0.0000E+00         1  0.0000E+00         1
 //E33   0.0000E+00         1  0.0000E+00         1
 //E12   0.0000E+00         1  0.0000E+00         1
 //E23   0.0000E+00         1  0.0000E+00         1
 //E31   0.0000E+00         1  0.0000E+00         1
 //S11   0.0000E+00         1  0.0000E+00         1
 //S22   0.0000E+00         1  0.0000E+00         1
 //S33   0.0000E+00         1  0.0000E+00         1
 //S12   0.0000E+00         1  0.0000E+00         1
 //S23   0.0000E+00         1  0.0000E+00         1
 //S31   0.0000E+00         1  0.0000E+00         1
 //SMS   0.0000E+00         1  0.0000E+00         1
 ##### Global Summary @Element :Max/IdMax/Min/IdMin####
 //E11   0.0000E+00         1  0.0000E+00         1
 //E22   0.0000E+00         1  0.0000E+00         1
 //E33   0.0000E+00         1  0.0000E+00         1
 //E12   0.0000E+00         1  0.0000E+00         1
 //E23   0.0000E+00         1  0.0000E+00         1
 //E31   0.0000E+00         1  0.0000E+00         1
 //S11   0.0000E+00         1  0.0000E+00         1
 //S22   0.0000E+00         1  0.0000E+00         1
 //S33   0.0000E+00         1  0.0000E+00         1
 //S12   0.0000E+00         1  0.0000E+00         1
 //S23   0.0000E+00         1  0.0000E+00         1
 //S31   0.0000E+00         1  0.0000E+00         1
 //SMS   0.0000E+00         1  0.0000E+00         1

 ...

#### Result step=    10
 ##### Local Summary @Node    :Max/IdMax/Min/IdMin####
 //U1    1.6169E+00      1600 -1.6123E+00     11901
 //U2    1.9281E+01      6877 -4.5296E-01      7096
 //U3    1.6087E+00      7016 -1.5107E+00      6934
 //E11   9.9108E-04     11242 -6.5834E-04      1404
 //E22   1.5025E-03     13972 -5.4245E-04      2367
 //E33   9.8320E-04      6833 -6.4744E-04      7000
 //E12   1.6822E-03      2698 -1.7175E-03     11906
 //E23   1.7082E-03      6749 -1.4469E-03     13509
 //E31   1.2090E-03     12475 -1.1181E-03     11342
 //S11   2.7781E+01      1086 -1.9439E+01      2363
 //S22   3.7876E+01     13972 -1.4556E+01      2367
 //S33   2.7335E+01      1086 -1.9745E+01     13082
 //S12   1.6817E+01      2698 -1.7170E+01     11906
 //S23   1.7077E+01      6749 -1.4463E+01     13509
 //S31   1.2086E+01     12475 -1.1178E+01     11342
 //SMS   3.7448E+01      2834  2.7593E-04      7333
 ##### Local Summary @Element :Max/IdMax/Min/IdMin####
 //E11   5.8557E-04      6613 -4.0802E-04      6416
 //E22   1.1391E-03      7144 -3.1424E-04      6613
 //E33   6.9233E-04      6130 -4.5897E-04      6222
 //E12   1.1076E-03       165 -1.1101E-03      5196
 //E23   1.4338E-03      6215 -9.2107E-04      6176
 //E31   9.6618E-04      5618 -7.4939E-04      4704
 //S11   1.7994E+01      6613 -1.2254E+01      6224
 //S22   2.7863E+01      7144 -7.3017E+00        24
 //S33   1.9725E+01      6613 -1.3385E+01      6222
 //S12   1.1072E+01       165 -1.1097E+01      5196
 //S23   1.4332E+01      6215 -9.2080E+00      6176
 //S31   9.6603E+00      5618 -7.4918E+00      4704
 //SMS   3.3151E+01      5619  3.3306E-04      2665
 ##### Global Summary @Node    :Max/IdMax/Min/IdMin####
 //U1    1.6169E+00      1600 -1.6123E+00     11901
 //U2    1.9281E+01      6877 -4.5296E-01      7096
 //U3    1.6087E+00      7016 -1.5107E+00      6934
 //E11   9.9108E-04     11242 -6.5834E-04      1404
 //E22   1.5025E-03     13972 -5.4245E-04      2367
 //E33   9.8320E-04      6833 -6.4744E-04      7000
 //E12   1.6822E-03      2698 -1.7175E-03     11906
 //E23   1.7082E-03      6749 -1.4469E-03     13509
 //E31   1.2090E-03     12475 -1.1181E-03     11342
 //S11   2.7781E+01      1086 -1.9439E+01      2363
 //S22   3.7876E+01     13972 -1.4556E+01      2367
 //S33   2.7335E+01      1086 -1.9745E+01     13082
 //S12   1.6817E+01      2698 -1.7170E+01     11906
 //S23   1.7077E+01      6749 -1.4463E+01     13509
 //S31   1.2086E+01     12475 -1.1178E+01     11342
 //SMS   3.7448E+01      2834  2.7593E-04      7333
 ##### Global Summary @Element :Max/IdMax/Min/IdMin####
 //E11   5.8557E-04      6613 -4.0802E-04      6416
 //E22   1.1391E-03      7144 -3.1424E-04      6613
 //E33   6.9233E-04      6130 -4.5897E-04      6222
 //E12   1.1076E-03       165 -1.1101E-03      5196
 //E23   1.4338E-03      6215 -9.2107E-04      6176
 //E31   9.6618E-04      5618 -7.4939E-04      4704
 //S11   1.7994E+01      6613 -1.2254E+01      6224
 //S22   2.7863E+01      7144 -7.3017E+00        24
 //S33   1.9725E+01      6613 -1.3385E+01      6222
 //S12   1.1072E+01       165 -1.1097E+01      5196
 //S23   1.4332E+01      6215 -9.2080E+00      6176
 //S31   9.6603E+00      5618 -7.4918E+00      4704
 //SMS   3.3151E+01      5619  3.3306E-04      2665